
CRE Finance World Summer 2015
12
is a banking center and together with Nashville has developed into
a southern alternative to Atlanta with less congestion and more
growth. Denver, Austin, and Portland have performed well and have
developed urban life that draws young people. San Diego is a long
time favorite destination and Indianapolis has done better than
average in drawing YCEs to its low cost environment.
Aside from the major and energy sector dependent markets, the list
favors Salt Lake City, Nashville, Denver, Austin, Orlando, San Diego,
Tampa, Portland and to a lesser extent Sacramento, Baltimore,
Buffalo, Indianapolis and Charlotte.
Stem Education and Hi Tech Employment Growth
High-Tech employment growth is directly correlated with the share
of residents with a Bachelor’s Degree in science, computer science
(Technology), engineering, or math (STEM)
13
. Markets with a
considerable amount of residents with STEM degrees combined
with a high growth rate of high-tech employment should portend
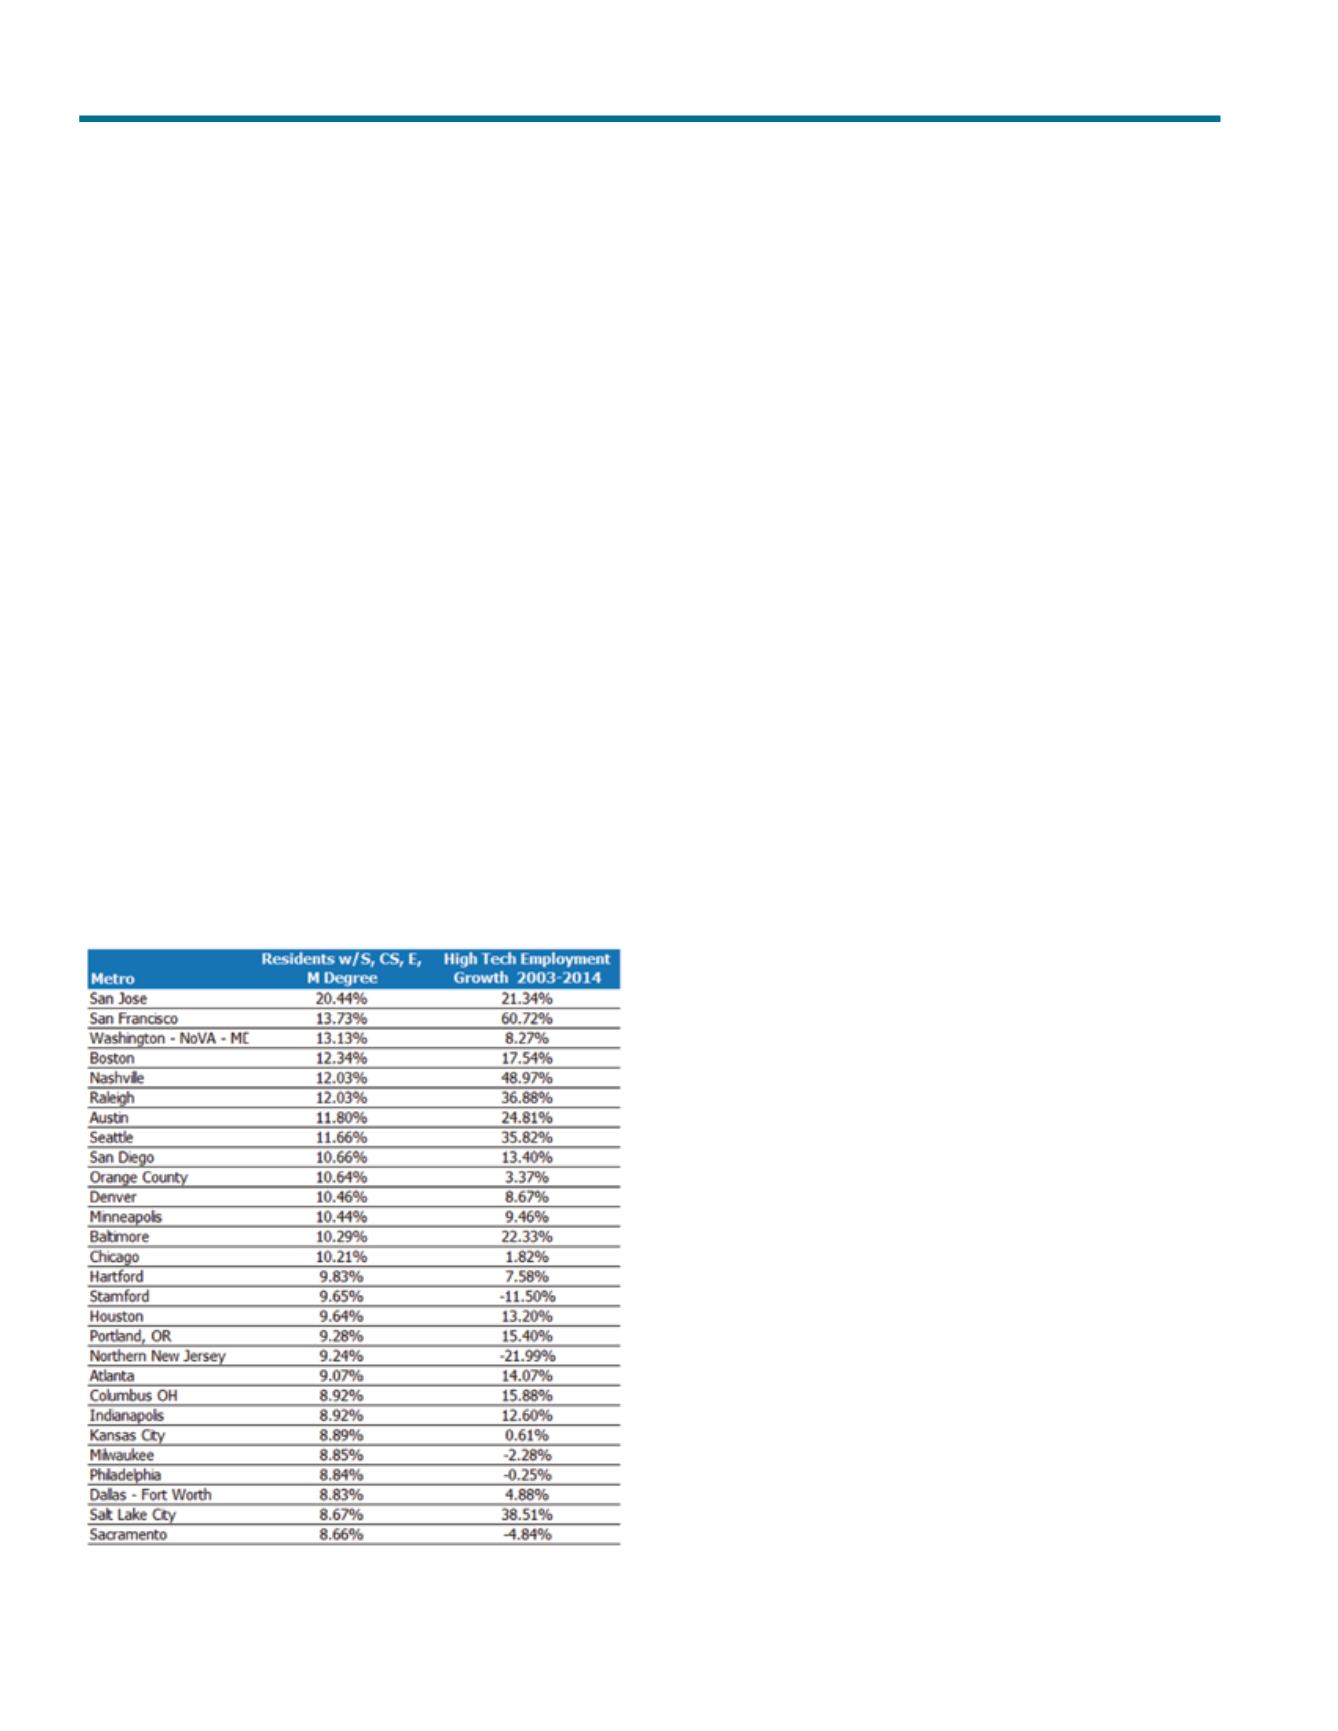
solid future growth. The chart below presents markets with a
strong pool of residents with a Bachelor’s Degree in STEM
14
.
Table 3
Source: U.S. Census; CoStar Portfolio Strategy
The above data concerning high-tech employment growth and
STEM education mostly favors the metros detailed in the upper
half of the charts. San Francisco, Nashville, and Salt Lake City
exhibited the strongest growth. With the exception of the major
markets, the list favors Nashville, Raleigh, Austin, Seattle, San
Diego, Denver, Salt Lake City, Minneapolis, Portland, Indianapolis,
and Columbus.
Markets with Tech Job Growth
Technology is not the largest sector of the labor force, but it
represents one of the major growth engines of overall employment.
Technology jobs constitute 5% of office-using demand in CBDs
and 8% in suburban markets, according to data from CoStar
Portfolio Strategy; however, they drive demand for other sectors
as well. Innovation technology reflects on the overall vibrancy of
the market. Consider that for 2014, net office space absorption
as a percentage of total inventory excelled in tech heavy markets
(San Jose, Seattle, San Francisco, Austin and Raleigh) (1.9% vs
1.1% for non-tech). The net absorption advantage of tech heavy
markets was even more substantial for the prior two year period
(3.5% vs 1.8% for non-tech) and the prior five year period (7.9%
vs 3.3% for non-tech). Enrico Moretti’s research indicates that for
each new high-tech job in a metropolitan area, five additional local
jobs are created
15
. The areas with strong growth rates, mostly, have
strong concentrations of high-tech office jobs. High-tech office
jobs are getting more concentrated as opposed to finance jobs
that are dispersing
16
.
The markets with the highest tech location quotients are as
expected in the San Francisco Bay area/Silicon Valley. Other
high-tech hubs include Seattle: 2.38, Boston: 1.97, Raleigh: 1.97,
Denver: 1.90 and San Diego: 1.62. Other markets with better than
average location quotients include regional economic capitals
Atlanta: 1.54, Dallas: 1.53, and Chicago: 1.09. Five of the top six
US investment markets score well
17
.
Office-Using Jobs
Office demand is driven by jobs that require office space. Office-
using jobs (OUJ) for the top 54 markets tracked by CoStar
increased 2.7% per year over the past five years and are forecast
to grow 2.1% over the next five years.
The markets that led growth patterns over the past five years where
Raleigh-Cary NC: 6.6%, Austin-Round Rock-San Marcos TX: 6.2%,
Nashville-Davidson-Murfreesboro-Franklin TN: 6.2%, San Jose-
Sunnyvale-Santa Clara CA: 5.6%, San Francisco-San Mateo-Red-
wood City CA: 5.4%, Jacksonville FL: 4.3%, Dallas-Fort Worth-
Arlington TX: 4.1%, Houston-Sugar Land-Baytown TX: 4.0%, Salt
Lake City UT: 3.9% and Miami-Miami Beach-Kendall FL: 3.9%.
Beyond The Big Six: Identifying Alternative Us Office Markets Based On Long Term Demand Generators


